
The most useful golf club distance calculator does not guess from age, handicap, or swing speed alone. It turns your own representative shots into four course-ready outputs: stock carry, safe carry, normal carry window, and the gap to the next club.
A golf rangefinder, launch monitor, or marked practice area can supply measurements. The calculator below supplies the decision structure.
Why Swing Speed Alone Is Not Enough
Swing speed matters, but it does not uniquely determine distance. Two golfers with the same speed can produce different carry because of:
- impact location;
- delivered loft;
- attack angle;
- ball speed and spin;
- launch height;
- club loft and shaft length;
- ball model;
- temperature and elevation.
FlightScope’s Trajectory Optimizer illustrates this principle: it compares actual launch conditions with a modeled potential, rather than converting club speed into one guaranteed yardage. Use a speed-based estimate to set a rough expectation, then overwrite it with measured carry.
If you need a full benchmark before collecting data, start with the golf club distance chart.
The Four-Output Calculator
Collect at least eight representative carry distances for one club. Ten is better. Remove only obvious accidents, then sort the numbers from shortest to longest.
Output 1: Stock carry
Use the median.
- Odd sample: select the middle value.
- Even sample: average the two middle values.
The median limits the influence of one unusually long or short shot.
Output 2: Safe carry
Use the lower quartile—the point near the 25th percentile—of the representative sample as a conservative planning estimate.
For a quick hand calculation with 8–12 sorted shots, take the median of the lower half. Round down to the nearest whole yard when a forced carry is involved.
This is not a statistical guarantee. It is a practical way to keep the lower part of your normal pattern visible. Add more margin when the penalty is severe.
Output 3: Normal carry window
Use the lower quartile to upper quartile range. This contains the middle half of the sample and helps separate a stable club from an erratic one.
Also retain the full representative minimum and maximum. The quartile window describes the center; the full window shows what still happened.
Output 4: Gap to the next club
Subtract the shorter club’s stock carry from the longer club’s stock carry:
Carry gap = Longer-club median carry − Shorter-club median carry
Do the same with safe carry. A clean median gap can hide overlapping lower windows.
Worked Example: Ten 7-Iron Shots
This dataset is illustrative, not a first-party test.
Sorted carries:
139, 143, 145, 146, 147, 148, 150, 151, 152, 160
Calculate stock carry
With 10 shots, average the fifth and sixth values:
(147 + 148) / 2 = 147.5
Stock carry rounds to 148 yards.
Calculate safe carry
The lower half is:
139, 143, 145, 146, 147
Its median is 145 yards. That becomes the practical safe-carry estimate before adding hazard-specific margin.
Calculate the normal window
The upper half is:
148, 150, 151, 152, 160
Its median is 151 yards. The middle-half window is therefore roughly 145–151 yards.
The full representative range remains 139–160. If 139 was an ordinary heavy strike rather than an accident, it should influence high-penalty decisions even though it sits outside the middle-half window.
The result is more honest than “my 7-iron goes 160.” For a deeper interpretation, see the average 7-iron distance guide.
Build the Spreadsheet
Use one row per club.
| Club | Shot count | Median carry | Safe carry | Middle-half window | Full window | Common miss | Confidence |
|---|---|---|---|---|---|---|---|
| Driver | |||||||
| 3W / 5W | |||||||
| Hybrid | |||||||
| 4–9 iron | |||||||
| PW / GW / SW / LW |
Spreadsheet formulas
If shot values are in cells B2:K2, common spreadsheet functions are:
- Stock carry:
=MEDIAN(B2:K2) - Lower quartile:
=QUARTILE.INC(B2:K2,1) - Upper quartile:
=QUARTILE.INC(B2:K2,3) - Full spread:
=MAX(B2:K2)-MIN(B2:K2)
Different spreadsheet programs may use slightly different function names. Check the program’s help before relying on the formula.
Confidence grade
Use a simple editorial grade:
- High: 10 or more representative shots, stable contact, narrow normal window, and on-course confirmation.
- Medium: 8–10 shots or a moderate window; useful with added margin.
- Low: fewer than 8 shots, mixed ball types, strong wind, or unstable contact.
The grade is a reminder about data quality, not a claim of statistical certainty.
Turn the Table Into a Gapping Chart
After calculating every club, sort by stock carry rather than club number.
Identify a true gap
A gap is a yardage you cannot cover with a confident normal shot. Before changing equipment:
- verify the samples;
- compare safe-carry windows;
- test a controlled swing with the longer club;
- check lofts;
- consult a fitter if the void remains.
Identify an overlap
Two clubs can share a median but serve different trajectories or lies. The overlap is a problem only when the jobs are also redundant.
The 4 hybrid distance comparison shows how a hybrid, long iron, and fairway wood can overlap numerically while solving different landing problems.
Treat wedges differently
One row per wedge is not enough. Create separate rows for stock, three-quarter, and half swings. The golf wedge distance chart provides the 12-cell method.
Course Validation Protocol
Range data is the baseline. The course is the field check.
For three rounds, log any approach where the landing point is visible or reliably measured:
- target and forced-carry distance;
- club and intended shot;
- lie, wind, temperature, and elevation;
- strike quality;
- observed landing point;
- whether the chart’s decision was appropriate.
Do not update the chart after one strange bounce. Update when repeated comparable shots show a meaningful shift.
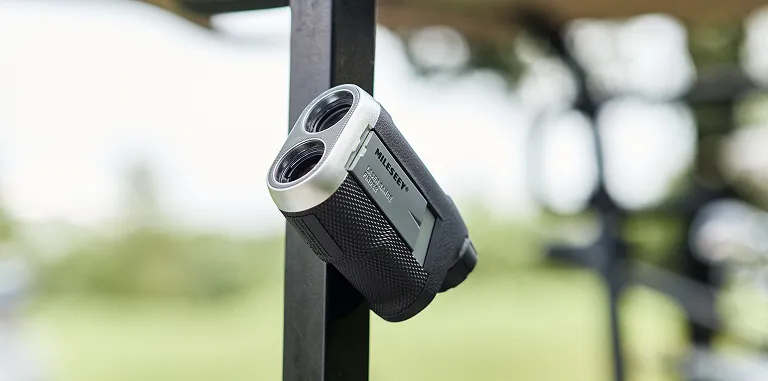
A simple laser can make this field check easier. The MILESEEY PF260 Tour provides basic slope-switch, flag-lock, vibration, and magnetic-mount functions according to the current official product record; National Club Golfer’s independent five-star review emphasized simple operation, compact size, and value (read the review). Use the measurement to verify geometry, not to replace the shot sample.
Environmental Adjustment: Add Notes, Not False Precision
Do not apply one universal “yards per degree” formula to every club. Ball speed, launch, spin, air density, wind, and elevation interact.
Instead:
- preserve a neutral baseline;
- record meaningful conditions;
- compare repeated on-course outcomes;
- add practical notes such as “cold morning: one more club from 150” only after evidence;
- rebuild at a new home elevation.
Trackman’s Map My Bag and Arccos Smart Distance both emphasize personalized profiles and real outcomes. That is more defensible than pretending a generic calculator can see your strike.
What Usually Goes Wrong
Deleting too many misses
Remove accidents, not evidence. A normal thin strike belongs in the playing profile.
Mixing carry and total
Never place them in the same column. Hazards demand carry; open fairways may reward total.
Combining ball types
Range balls and course balls may not behave alike. Use one model or label the dataset.
Testing until the number looks good
Set the shot count before starting. Do not continue merely to replace short outcomes.
Treating quartiles as guarantees
A lower quartile still fails roughly one part of the sample below it. Severe hazards require additional margin or a different club.
Ignoring direction
A narrow carry window with a wide left-right pattern is not high confidence. Add dispersion.
When This Advice Does Not Apply
The calculator is unreliable during pain, a major swing change, severe fatigue, or highly inconsistent contact. It also cannot diagnose launch, spin, shaft, or lie-angle problems.
Use a coach or fitter when adjacent clubs repeatedly overlap, the sample has no stable center, or a new club produces unexpected flight. Juniors and golfers changing speed rapidly should refresh the chart more often.
The Final Decision Rule
Use:
- median carry for an ordinary open target;
- safe carry plus margin for a forced carry;
- normal total for open tee-shot planning;
- dispersion and common miss to select the target;
- confidence grade to decide how much trust the number deserves.
That is the real value of a golf club distance calculator: not predicting a heroic yardage, but converting your own shots into a decision you can defend.