.png?w=1500&h=927)
Most golf club distance charts answer the easiest question—how far a club can go—while leaving out the number that actually chooses a club over water. A golf rangefinder can confirm the target distance, but it cannot rescue a chart built from your single best strike.
The useful answer is a two-part one:
- Use average yardages only as a starting point.
- Replace them with four personal numbers for every club: stock carry, safe carry, normal total distance, and miss window.
That distinction matters. Trackman defines carry as the distance the ball flies before landing and recommends choosing clubs from average carry rather than the longest shot. Its 2025 Map My Bag guidance also notes that golfers commonly remember numbers 10–15 yards longer than their real-world patterns. In other words, the honest number is usually less flattering—and far more useful.
A Practical Golf Club Distance Chart
The ranges below are starting bands, not promises. They describe plausible recreational-golfer carry windows with a normal full swing. Loft, ball speed, strike quality, launch, elevation, temperature, turf, and the ball can move an individual golfer well outside them.
| Club | Starting carry band (yards) | Typical on-course job |
|---|---|---|
| Driver | 170–250+ | Maximum tee-shot distance |
| 3-wood | 160–225 | Tee accuracy or long fairway shot |
| 5-wood | 150–210 | High-launch long approach |
| 4 hybrid | 145–200 | Long approach, rough, or iron replacement |
| 5-iron | 135–185 | Long-to-mid approach |
| 6-iron | 125–175 | Mid-iron approach |
| 7-iron | 115–165 | Stock approach and benchmark club |
| 8-iron | 105–155 | Controlled approach |
| 9-iron | 95–145 | Short approach |
| Pitching wedge | 80–130 | Full scoring shot |
| Gap wedge | 65–115 | Full or controlled scoring shot |
| Sand wedge | 50–100 | Short approach, bunker, partial shot |
| Lob wedge | 35–85 | Height and short carry when the lie allows |
These bands are intentionally wide. The USGA/R&A’s 2024 Distance Report illustrates why one “average golfer” number is misleading: its final amateur sample reported a 215.6-yard overall driving average, while handicap groups ranged from 176.6 yards for 21-plus handicaps to 239.2 yards for golfers below a 6 handicap. The sample also reflects particular golfers, venues, and measurement years; it is a reference point, not a prescription for your swing.
For a deeper benchmark, compare your tee shots with the average-driver-distance guide, then check the clubs that shape approach play in the 7-iron distance analysis.
The Four Numbers Every Club Needs
A one-column chart hides the decisions that cause penalties. Build four columns instead.
1. Stock carry
Stock carry is the median carry of solid, normal-tempo shots—not the longest and not a forced swing. Use it for ordinary approaches when a short miss is playable.
2. Safe carry
Safe carry is a conservative number you can clear repeatedly. A practical starting rule is the lower edge of your normal carry window. If your five representative 7-irons carry 146, 148, 149, 151, and 154 yards, the stock carry is 149, but a safer planning number over water may be 146–147.
3. Normal total distance
Total distance adds bounce and roll. It matters most with driver, fairway woods, hybrids, and low-running shots. It matters less when the ball must stop near a tucked pin. Never substitute total distance for carry when the hazard occupies the landing area.
4. Miss window
Record the usual short-long range and left-right pattern. “7-iron: 149 carry” is incomplete. “7-iron: 149 median carry, 145 safe carry, 8-yard normal window, common miss short-right” can guide a target.
Arccos reported that 40% of more than six million tracked approach shots finished short of the green—eight times the share that finished long. Its club-by-club analysis also found that golfers’ selected starting yardages exceeded median outcomes. That evidence supports a simple editorial position: your distance card should protect against the ordinary strike, not celebrate the perfect one.
How to Build Your Personal Chart in One Session
You do not need a tour van or a 100-shot study. You need a consistent ball, a defined target, and enough usable shots to expose your normal pattern.
Step 1: Standardize the test
- Warm up before recording anything.
- Use the same ball model when possible. If you are comparing balls, first review how construction and condition affect flight in this golf-ball selection guide.
- Test in calm conditions or write down the wind and temperature.
- Use a flat lie for the baseline.
- Separate range-ball results from premium-ball results.
Step 2: Hit a small, honest sample
Hit 8–10 shots per club. Remove only obvious non-representative events—a top that rolls 60 yards or a slipped swing—not every shot you dislike. Keep normal mishits because they define the decision risk.
For a fast version, test driver, one fairway or hybrid, 7-iron, 9-iron, and every wedge first. Fill the remaining irons in a second session.
Step 3: Use the median, not the hero ball
Sort the valid carry distances. The middle value is the median. With an even number of shots, average the two middle values. Median resists one unusually long or short result better than a simple mean.
The companion golf club distance calculator method shows the exact worksheet, including safe carry and confidence bands.
Step 4: Check the gaps
Move from one club to the next and compare medians. You are looking for useful separation—not a cosmetically perfect chart. Two clubs with only a few yards between them may be duplicates. A 25-yard hole may demand a different loft, shaft, or shot shape.
Pay special attention at the top and bottom of the bag. The 4-hybrid distance comparison explains how to decide among a hybrid, long iron, and fairway wood by landing window rather than name. Inside scoring range, build multiple swings with the golf wedge distance chart.
Step 5: Transfer the chart to the course
The range establishes a baseline; the course verifies it. For three rounds, note:
- measured target distance;
- selected club;
- lie and elevation;
- wind and temperature;
- strike quality;
- where the ball landed, not merely where it finished.
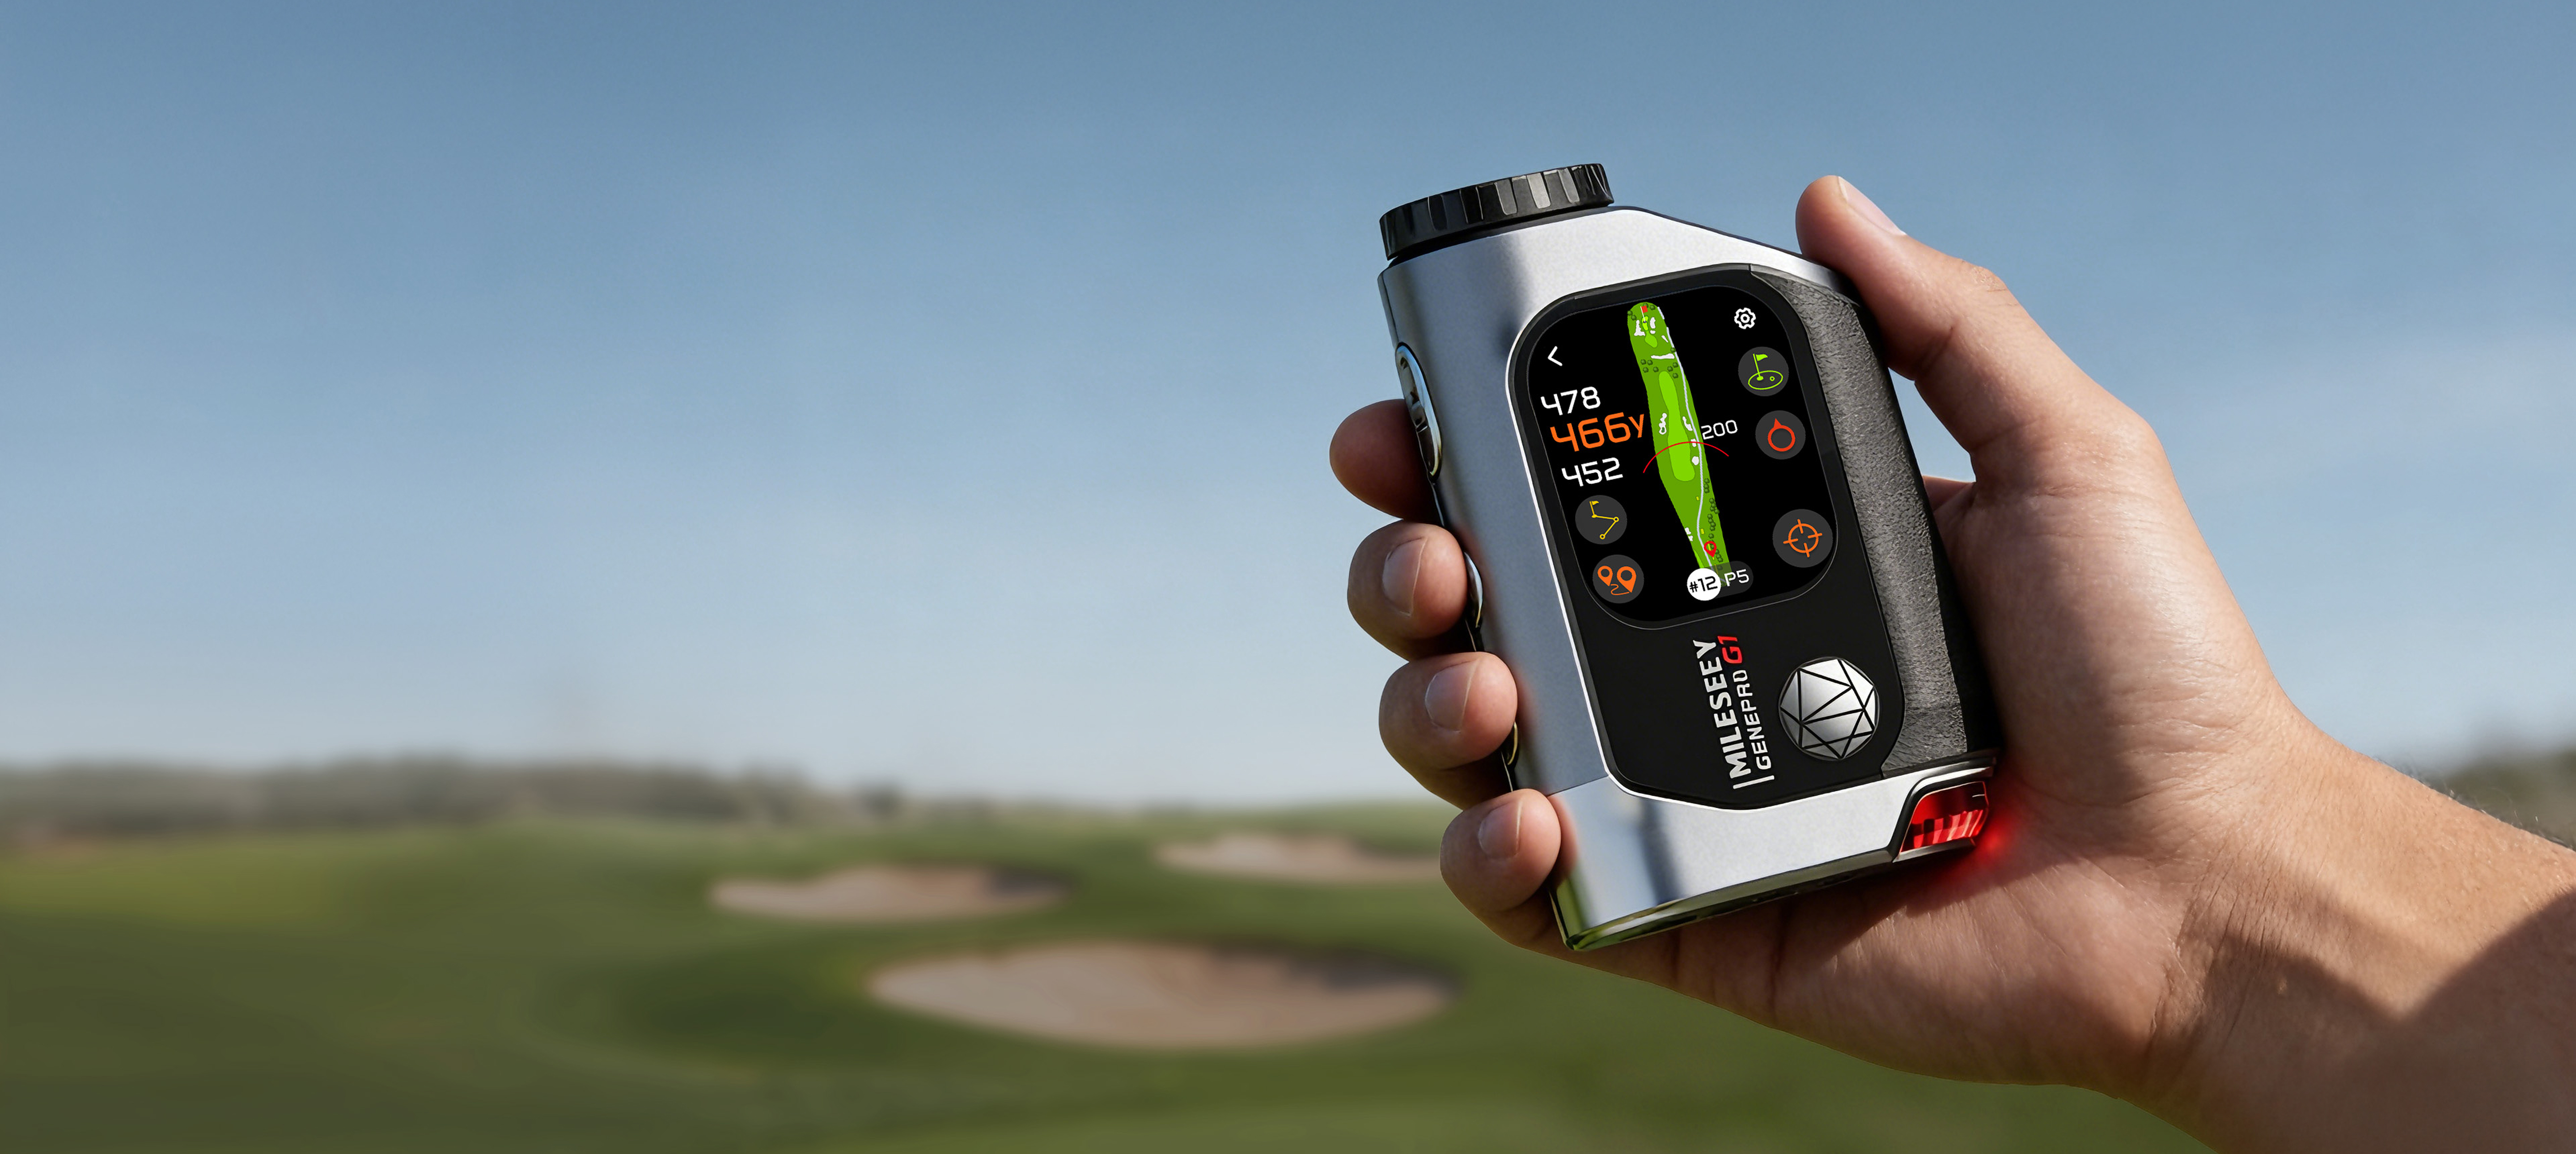
If you want laser distance plus hole-map context in one device, the MILESEEY GenePro G1 combines both; Plugged In Golf’s independent review found its laser fast and accurate and said the on-device map avoided the usual compromise of a hybrid unit, while also noting that scoring and shot tracking were less intuitive than on a dedicated device (read the review). That makes it a context tool, not a substitute for honest carry testing.
Worked Example: Choosing a Club Over Water
This is an illustrative scenario, not a claim about a real player.
A golfer records the following 7-iron carries: 143, 146, 147, 149, 150, 151, 152, and 158 yards. The 158-yard strike is real, but it is not the normal result.
- Median stock carry: (149 + 150) / 2 = 149.5 yards
- Lower normal window: roughly 145 yards
- Hero-ball memory: 158 yards
On the course, the front of the green is 147 yards away, but a creek must be carried at 145. The pin is 154. The 7-iron can reach the pin on a strong strike, yet its safe carry is too close to the creek. Taking one more club and aiming away from the worst miss is the higher-percentage decision.
The key is not “hit more club” in every situation. It is to compare the required carry with the conservative end of your own window.
What Usually Goes Wrong
Mixing carry and total
A launch monitor may show both numbers. A course marker or final ball position usually reflects a different thing. Label every entry.
Building the chart with range balls
Range balls vary by model, wear, temperature, and limited-flight design. Use them to compare relative gaps, then verify absolute carry with your normal ball.
Deleting ordinary misses
If you remove every thin or slightly heavy strike, the chart stops representing your game. Remove accidents; retain normal variability.
Using one weather condition forever
Cold air, elevation, wind, wet turf, and firm fairways change outcomes. Keep the baseline and add simple adjustment notes rather than rebuilding the entire chart for every forecast.
Copying somebody else’s lofts
Two “7-irons” can have different loft, shaft length, center of gravity, and launch. Compare outcomes, not the number stamped on the sole.
When This Advice Does Not Apply
A self-built chart is not a medical diagnosis or a club fitting. Pause the test if pain changes your motion. Seek a qualified coach or fitter when two clubs repeatedly overlap, contact is too inconsistent to form a stable window, or equipment changes produce unexpected launch and spin.
Juniors, golfers returning from injury, and players undergoing a major swing change should update the chart more often. A golfer at high elevation also needs a local baseline; Arccos’s 2026 driving report found a meaningful elevation effect in its tracked sample, so sea-level numbers should not be treated as universal.
Your One-Page Distance Card
Use this compact format for every club:
| Club | Stock carry | Safe carry | Normal total | Typical miss | Confidence |
|---|---|---|---|---|---|
| Driver | High / Medium / Low | ||||
| Fairway / hybrid | High / Medium / Low | ||||
| 4–6 iron | High / Medium / Low | ||||
| 7–9 iron | High / Medium / Low | ||||
| PW / GW / SW / LW | High / Medium / Low |
Update a club when at least three rounds show a consistent shift, not after one unusually good shot. The goal is not to own an impressive chart. It is to make the next decision with a number you can trust.
Related Guides
- Average driver distance: realistic benchmarks and a three-number test
- Average 7-iron distance: carry benchmarks and a ten-shot test
- Golf wedge distance chart: stock, three-quarter, and half swings
- 4 hybrid distance: compare the landing windows of common alternatives
- Golf club distance calculator: turn your own shots into a carry chart